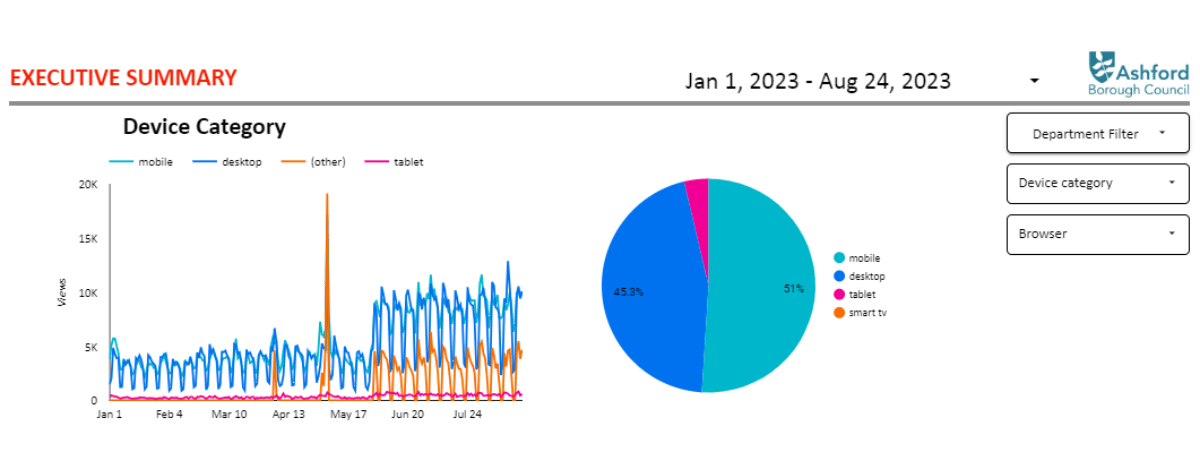
Google Analytics released a new product last year called Google Analytics 4 (GA4), which replaced the former version, Universal Analytics (UA).
For a while both products could be used to track website traffic but UA was stood down at the end of June 2023, meaning we are now reliant on GA4 data moving forwards.
Tracking
Google Analytics is able to gather website analytics by inserting a tracking code into the codebase of a website. The Digital Transformation team worked through to add the new GA4 code to the various websites in Ashford Borough Council’s web estate, including:
- www.ashford.gov.uk
- www.ashfordporthealth.gov.uk
- www.loveashford.com
- www.ashfordfor.com
- www.experienceashfordandtenterden.co.uk
- www.aspirelm.co.uk
- www.lifelineanytime.co.uk
- www.abetterchoiceforproperty.com
- www.digital.ashford.gov.uk
New Metrics
Having setup the tracking for GA4 we had to acquaint ourselves with the new tracking model. Compared to UA, there are now less metrics that are automatically generated by Google Analytics. As a result, we no longer see data for key metrics such as unique pageviews or average time spent on a particular webpage.
It appears as though GA4 is an ever-evolving product, so we are hoping that some of those metrics are generated again in the future. For now, we are using alternative metrics, such as pageviews, which isn’t as accurate in terms of the number of users on a particular webpage as it will double count users who visit the same page on a different day, rather than that visitor only counting as one unique user.
Historic Data
Now that UA has stopped tracking we needed a way to preserve the historic data that we have so that we can compare and track our website’s usage over a longer period of time.
The current iteration of www.ashford.gov.uk went live in August 2020 so we have downloaded all of the key website data since that period. All of this downloaded data has been stored in a SQL database which can be viewed on a Google Looker Studio dashboard.
Reporting
Now we have two data sources of information for our main website’s tracking data – a SQL database (for data from August 2020-June 2023) and GA4 direct data (for data from July 2023 onwards). We have re-engineered our reporting dashboards so that they point to each of these data sets. This enables us to compare and contrast with historic information about how the website is being used.

